LeakMon is a light weight resource leak tracking utility which can track Memory leaks, GDI object leaks and handle leaks of a process. This tool is suitable mainly for tracking down the leaks that happens in between an operation.
Downloads
LeakMon
[Download from Codeproject]
LeakMon
Prerequisite
• You need to have installed VS2010 or Microsoft Visual C++ 2010 Redistributable Package.
Visual C++ 2010 Redistributable Package can be downloaded from the below path
For 32 bit applications (4.8 MB)
http://www.microsoft.com/downloads/en/details.aspx?familyid=A7B7A05E-6DE6-4D3A-A423-37BF0912DB84&displaylang=en
For 64 bit application (5.5 MB)
http://www.microsoft.com/downloads/en/details.aspx?familyid=BD512D9E-43C8-4655-81BF-9350143D5867&displaylang=en
How to use
This tool consists of three binaries, Injector, HookDll and a DumpViewer.
To start with, run the Injector.exe.

• Refresh :- Refresh the process list
• Inject :- Injects the hook DLL to the target process to start tracking of the leak
• Dump : - Dumps the leak found so far to a file.
• Reset: :- Ignore/Clear all the leaks found up to this point.
• PDB Info : - After Injecting the DLL to the target process, you can click this button to view and make sure that all the pdb’s of necessary DLL’s are loaded correctly.

The setting window allows you to choose the “type of leak” you want to track. The types include memory leak, GDI leak and Handle leak.
The next option in the Settings dialog is “Stack Depth”. The value in the stack depth controls the number of functions that will be retrieved while tracking the allocation call stack. The value you enter in here can considerably affect the speed of the application. Lesser the value, the faster the application will be.
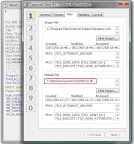
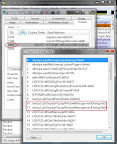
Collecting the call stack will never be perfect, without proper PDB files. So to get proper call stack information, specify the path PDB files of the binaries used in your application. Without the pdb’s of Microsoft dll’s such as MSVCRT.dll, MFCxx.dll etc, you will not be able to see the call stack of memory allocated using new and new[] sometimes. If you don’t have the symbols for Microsoft dlls, click on the “Add Symbol server”. Also it is a must that you have to specify the Folder in which the LeakMon binary resides. (“T:\LeakMon” in the below sample). Once you have set all the necessary pdb’s path click OK. The tracking starts from this moment
So now, once you have finished your processing and want to see all the allocations that haven’t de-allocated, press the “Dump” button in the injector. If there is some leak, it will prompt you with a save dialog, though which you can save the leak information file.
Analyzing the leak dump file
I will explain the format of the dump file with the following example. Consider the below code
 i.e. The sequence of calling is in the order
CMulitThreadDlg::OnBnClickedButton1()->func1()->func2().
Starting from the top function, traverse down, until you find a function from your file. In the above case, func2(). So it can be concluded that, some memory that has allocated from the func2() haven’t de-allocated.
Analyzing the leak with DumpViewer
Even though you can viewer the dump file in any text editor, DumpViewer provides you some extra features that are really handy. Most of the features are self explanatory. One of the main feature is that, when you double click on a particular function in the tree, it will open the source file in visual studio with the line in which leak occurred as selected.

Downloads
LeakMon
[Download from Codeproject]
LeakMon
Prerequisite
• You need to have installed VS2010 or Microsoft Visual C++ 2010 Redistributable Package.
Visual C++ 2010 Redistributable Package can be downloaded from the below path
For 32 bit applications (4.8 MB)
http://www.microsoft.com/downloads/en/details.aspx?familyid=A7B7A05E-6DE6-4D3A-A423-37BF0912DB84&displaylang=en
For 64 bit application (5.5 MB)
http://www.microsoft.com/downloads/en/details.aspx?familyid=BD512D9E-43C8-4655-81BF-9350143D5867&displaylang=en
How to use
This tool consists of three binaries, Injector, HookDll and a DumpViewer.
To start with, run the Injector.exe.

• Refresh :- Refresh the process list
• Inject :- Injects the hook DLL to the target process to start tracking of the leak
• Dump : - Dumps the leak found so far to a file.
• Reset: :- Ignore/Clear all the leaks found up to this point.
• PDB Info : - After Injecting the DLL to the target process, you can click this button to view and make sure that all the pdb’s of necessary DLL’s are loaded correctly.
Using the injector.exe, select the target process that you want to debug. In this case say "MultiThread.exe". Now to start tracking, click the “Inject” button. On doing this, a settings window as in the below figure will pop up. (Note: The settings window is actually shown in the target process' context).

The setting window allows you to choose the “type of leak” you want to track. The types include memory leak, GDI leak and Handle leak.
The next option in the Settings dialog is “Stack Depth”. The value in the stack depth controls the number of functions that will be retrieved while tracking the allocation call stack. The value you enter in here can considerably affect the speed of the application. Lesser the value, the faster the application will be.
Collecting the call stack will never be perfect, without proper PDB files. So to get proper call stack information, specify the path PDB files of the binaries used in your application. Without the pdb’s of Microsoft dll’s such as MSVCRT.dll, MFCxx.dll etc, you will not be able to see the call stack of memory allocated using new and new[] sometimes. If you don’t have the symbols for Microsoft dlls, click on the “Add Symbol server”. Also it is a must that you have to specify the Folder in which the LeakMon binary resides. (“T:\LeakMon” in the below sample). Once you have set all the necessary pdb’s path click OK. The tracking starts from this moment
So now, once you have finished your processing and want to see all the allocations that haven’t de-allocated, press the “Dump” button in the injector. If there is some leak, it will prompt you with a save dialog, though which you can save the leak information file.
Analyzing the leak dump file
I will explain the format of the dump file with the following example. Consider the below code
CMulitThreadDlg::OnBnClickedButton1()->func1()->func2().
Now the information regarding the memory leak in the above code will look as follows.
-->Bytes allocated -- 76
_heap_alloc_base f:\dd\vctools\crt_bld\self_x86\crt\src\malloc.c(105)
_heap_alloc_dbg_impl f:\dd\vctools\crt_bld\self_x86\crt\src\dbgheap.c(427)
_nh_malloc_dbg_impl f:\dd\vctools\crt_bld\self_x86\crt\src\dbgheap.c(239)
_nh_malloc_dbg f:\dd\vctools\crt_bld\self_x86\crt\src\dbgheap.c(296)
_malloc_dbg f:\dd\vctools\crt_bld\self_x86\crt\src\dbgheap.c(160)
operator new f:\dd\vctools\vc7libs\ship\atlmfc\src\mfc\afxmem.cpp(407)
operator new[] f:\dd\vctools\vc7libs\ship\atlmfc\src\mfc\afxmem.cpp(442)
operator new[] f:\dd\vctools\vc7libs\ship\atlmfc\src\mfc\afxmem.cpp(67)
func2 t:\naveen\pgms\cpp\2008\mulitthread\mulitthreaddlg.cpp(178)
func1 t:\naveen\pgms\cpp\2008\mulitthread\mulitthreaddlg.cpp(184)
CMulitThreadDlg::OnBnClickedButton1 t:\naveen\pgms\cpp\2008\mulitthread\mulitthreaddlg.cpp(189)
_AfxDispatchCmdMsg f:\dd\vctools\vc7libs\ship\atlmfc\src\mfc\cmdtarg.cpp(82)
CCmdTarget::OnCmdMsg f:\dd\vctools\vc7libs\ship\atlmfc\src\mfc\cmdtarg.cpp(381)
CDialog::OnCmdMsg f:\dd\vctools\vc7libs\ship\atlmfc\src\mfc\dlgcore.cpp(85)
CWnd::OnCommand f:\dd\vctools\vc7libs\ship\atlmfc\src\mfc\wincore.cpp(2364)
CWnd::OnWndMsg f:\dd\vctools\vc7libs\ship\atlmfc\src\mfc\wincore.cpp(1769)
CWnd::WindowProc f:\dd\vctools\vc7libs\ship\atlmfc\src\mfc\wincore.cpp(1755)
_heap_alloc_base f:\dd\vctools\crt_bld\self_x86\crt\src\malloc.c(105)
_heap_alloc_dbg_impl f:\dd\vctools\crt_bld\self_x86\crt\src\dbgheap.c(427)
_nh_malloc_dbg_impl f:\dd\vctools\crt_bld\self_x86\crt\src\dbgheap.c(239)
_nh_malloc_dbg f:\dd\vctools\crt_bld\self_x86\crt\src\dbgheap.c(296)
_malloc_dbg f:\dd\vctools\crt_bld\self_x86\crt\src\dbgheap.c(160)
operator new f:\dd\vctools\vc7libs\ship\atlmfc\src\mfc\afxmem.cpp(407)
operator new[] f:\dd\vctools\vc7libs\ship\atlmfc\src\mfc\afxmem.cpp(442)
operator new[] f:\dd\vctools\vc7libs\ship\atlmfc\src\mfc\afxmem.cpp(67)
func2 t:\naveen\pgms\cpp\2008\mulitthread\mulitthreaddlg.cpp(178)
func1 t:\naveen\pgms\cpp\2008\mulitthread\mulitthreaddlg.cpp(184)
CMulitThreadDlg::OnBnClickedButton1 t:\naveen\pgms\cpp\2008\mulitthread\mulitthreaddlg.cpp(189)
_AfxDispatchCmdMsg f:\dd\vctools\vc7libs\ship\atlmfc\src\mfc\cmdtarg.cpp(82)
CCmdTarget::OnCmdMsg f:\dd\vctools\vc7libs\ship\atlmfc\src\mfc\cmdtarg.cpp(381)
CDialog::OnCmdMsg f:\dd\vctools\vc7libs\ship\atlmfc\src\mfc\dlgcore.cpp(85)
CWnd::OnCommand f:\dd\vctools\vc7libs\ship\atlmfc\src\mfc\wincore.cpp(2364)
CWnd::OnWndMsg f:\dd\vctools\vc7libs\ship\atlmfc\src\mfc\wincore.cpp(1769)
CWnd::WindowProc f:\dd\vctools\vc7libs\ship\atlmfc\src\mfc\wincore.cpp(1755)
Analyzing the leak with DumpViewer
Even though you can viewer the dump file in any text editor, DumpViewer provides you some extra features that are really handy. Most of the features are self explanatory. One of the main feature is that, when you double click on a particular function in the tree, it will open the source file in visual studio with the line in which leak occurred as selected.

Under the Hood
This application basically works by hooking all the possible functions that allocates and de allocates a resource. For example when tracking memory leak it hooks the memory allocation API's such as HeapAlloc, HeapFree, VirtualAlloc, VirtualFree etc. A more detailed step by step explanation of this tool will be posted in next posts.
I have tried my best to remove the bugs in this application. But still if you encounter any bugs, let me know. Suggestions or improvements are highly appreciated.
[Update] :- Part 2 Leakmon- Under the hood